Running vLLM on Consumer Hardware: The VRAM Math, Memory Management, and Why It Beats llama.cpp
Introduction
In my previous post I spent weeks getting llama.cpp to run 27B and 35B models on a 5-year-old consumer PC (Normandy, the dual RTX 5060 Ti 16GB rig). That post ended with a verdict: llama.cpp is ideal for a single user, and vLLM is "enterprise GPUs only". That verdict is outdated.
vLLM works like a charm on consumer hardware. It just ships with enterprise defaults (P2P GPU communication, aggressive memory utilization, no GGUF) and it demands a different discipline: you must understand your VRAM budget, or it will crash on you at the worst possible moment.
This post covers the setup with my real docker compose, the real VRAM math from my startup log (including the parts vLLM's own numbers don't cover), the OOM spike I hit and how I fixed it, and why vLLM ended up beating llama.cpp on everything that matters for multi-agent work. The model in every screenshot and number below is Qwen3.8-27B-AWQ-INT4, a 19.57 GiB checkpoint with native MTP, served by vLLM v0.26.0 with tensor parallelism across both 16 GB cards.
Why vLLM Now
The trigger was simple: I want to run multiple agents in parallel (coding tasks, document analysis, background jobs), and llama.cpp's single-stream design means every agent waits in line. vLLM's core value is continuous batching with PagedAttention: every request in flight shares the same GPU time and the same paged KV pool, so 8 concurrent agents don't degrade each other much. That's the part llama.cpp fundamentally can't do.
The Setup: One Docker Compose, No Enterprise Hardware
Hardware Requirements (Consumer Grade)
You do not need enterprise hardware. You need:
- GPU(s) with enough VRAM to fit the model: weights + MTP module + KV cache + overhead, all in VRAM. vLLM does not gracefully spill to system RAM the way llama.cpp does; if the model doesn't fit, it fails fast at startup. That's a feature: no silent 1 tok/s degradation.
- Enough system RAM to support the server: the vLLM server process alone typically consumes around 16GB of RAM at peak (scheduler, tokenizer, page cache of the checkpoint, CUDA host buffers). But you don't necessarily need 24 or 32GB. The Linux kernel handles overflow into swap automatically, and on consumer hardware the impact is negligible. I ran it on a 16 GB RAM machine and it just works (see System RAM and Swap).
My Docker Compose
No installations, no CUDA toolkit, no Python environment: a single Docker Compose runs on any machine with an NVIDIA GPU. My actual compose file:
services:
  vllm:
    image: vllm/vllm-openai:latest
    container_name: vllm-qwen3.8-awq
    ports:
      - "1235:8000"
    environment:
      - VLLM_CACHE_ROOT=/root/.cache/vllm
      - TRITON_CACHE_DIR=/root/.cache/triton
      # Kills allocator fragmentation (see "The PyTorch Spike" below)
      - PYTORCH_CUDA_ALLOC_CONF=expandable_segments:True
      - OMP_NUM_THREADS=1
    volumes:
      # Local HF-format checkpoint, no Hugging Face download at boot
      - /home/david/models/cyankiwi/Qwen3.8-27B-AWQ-INT4:/model
      # Persist the torch.compile + Triton caches: boots much faster after first run
      - vllm_compilation_disk:/root/.cache/vllm
      - triton_compilation_disk:/root/.cache/triton
    ipc: host   # NCCL shared memory for multi-GPU (or use shm_size in Docker Compose)
    deploy:
      resources:
        reservations:
          devices:
            - driver: nvidia
              count: all
              capabilities: [gpu]
    command:
      - --model=/model
      - --served-model-name=qwen3.8-27b-awq
      - --max-model-len=auto            # let vLLM auto-fit, then read the log (Trick #1)
      - --kv-cache-dtype=fp8            # halves the KV pool cost
      - --gpu-memory-utilization=0.92
      # --kv-cache-memory=3113851648    # pin it once you know the value (see Trick #1)
      - --max-num-seqs=8                # benchmarked max concurrency for this rig
      - --tensor-parallel-size=2        # single GPU: use 1 and drop the NCCL flags
      - --enable-auto-tool-choice       # agent-ready: tool calling out of the box
      - --reasoning-parser=qwen3
      - --tool-call-parser=qwen3_coder
      - --trust-remote-code
      - --attention-backend=flashinfer
      - --max-num-batched-tokens=8192   # chunked prefill sweet spot: fast prompts, bounded memory
      - --disable-custom-all-reduce     # multi-GPU over PCIe: use plain NCCL
      - --async-scheduling
      - --enable-prefix-caching         # cached prefill for repeated prompts (see section below)
      - --enable-prompt-tokens-details
      - --speculative-config
      - '{"method": "mtp", "num_speculative_tokens": 2}'
      - --override-generation-config
      - '{"temperature": 1.0, "top_p": 0.95, "top_k": 20, "min_p": 0.0, "presence_penalty": 0.0, "repetition_penalty": 1.0}'

volumes:
  vllm_compilation_disk:
  triton_compilation_disk:
Notes on the choices:
- No GGUF: vLLM loads Hugging Face safetensors. I mount the quantized checkpoint from local disk, so there's no download at boot.
ipc: host: Docker's default shared memory (64MB) is far too small for NCCL multi-GPU communication. The official vLLM Docker docs recommendipc=hostor a larger--shm-size.- Compilation cache volumes: vLLM persists
torch.compileand Triton artifacts underVLLM_CACHE_ROOT. First boot compiles everything; every boot after that loads the compiled graphs straight from disk. --kv-cache-dtype=fp8: stores the KV pool in 8-bit float instead of the usual fp16. Same context, half the VRAM. Why I use it: Trick #4.--max-num-batched-tokens=8192: the sweet spot for prompt processing on consumer cards. vLLM ingests long prompts with chunked prefill: at most 8192 prompt tokens are processed per step. Big enough that prompt fetching stays fast, small enough that the prefill activation memory (which scales with the tokens in flight) is bounded, so a 50K-token prompt never saturates the memory.--max-num-seqs=8: the maximum concurrency this rig achieves; Batching explains how I benchmarked it.--max-model-len=auto: I'll explain why I leave this at auto in Trick #1.- Agent flags:
--enable-auto-tool-choice,--tool-call-parserand--reasoning-parsermake the server a proper agent endpoint: tool calls and reasoning blocks come back cleanly parsed, no client-side hacks. --speculative-configwith MTP: the model ships with a native multi-token prediction module; vLLM auto-detects it and runs speculative decoding with 2 draft tokens per step, the number I benchmarked as optimal for this rig (Trick #5). No separate draft model to download.
Consumer-Hardware Quirks: The Enterprise Defaults (P2P)
It works like a charm on consumer hardware, but the default settings always try to enable enterprise features, the most annoying being P2P (peer-to-peer) GPU communication. With tensor parallelism, vLLM uses NCCL, and NCCL will happily try to set up direct P2P transfers between the GPUs, the way it does on an NVLink server. On a consumer PCIe motherboard, that path is often unavailable, slow, or hangs entirely (PCIe ACS, chipset lanes, etc.).
The two settings that fix it:
NCCL_P2P_DISABLE=1: env var, tells NCCL to skip P2P and use shared memory / PCIe copy paths.--disable-custom-all-reduce: drops vLLM's custom all-reduce kernel (designed for NVLink) and falls back to plain NCCL.
On a single GPU, none of this matters: there's no inter-GPU communication at all.
The VRAM Budget: What vLLM Counts and What It Doesn't
The Five Components
Here is every byte of VRAM vLLM touches, split into what vLLM actually reports and what it doesn't:
| # | Component | Reported by vLLM? | Notes |
|---|---|---|---|
| 1 | Model weights | ✅ | Static; set by parameter count × dtype (or quantization) |
| 2 | MTP model weight | ✅ (included in total) | Only if you enable speculative decoding with an MTP model |
| 3 | KV cache | ✅ | Pre-allocated pool: "GPU KV cache size: N tokens" |
| 4 | PyTorch overhead | ⚠️ partially (activation peak only) | CUDA context, caching allocator reservations, CUDA graphs |
| 5 | Other overheads | ⚠️ partially (non_torch_memory) | NCCL/P2P buffers, cuBLAS/cuDNN/FlashAttention workspaces, driver reservation |
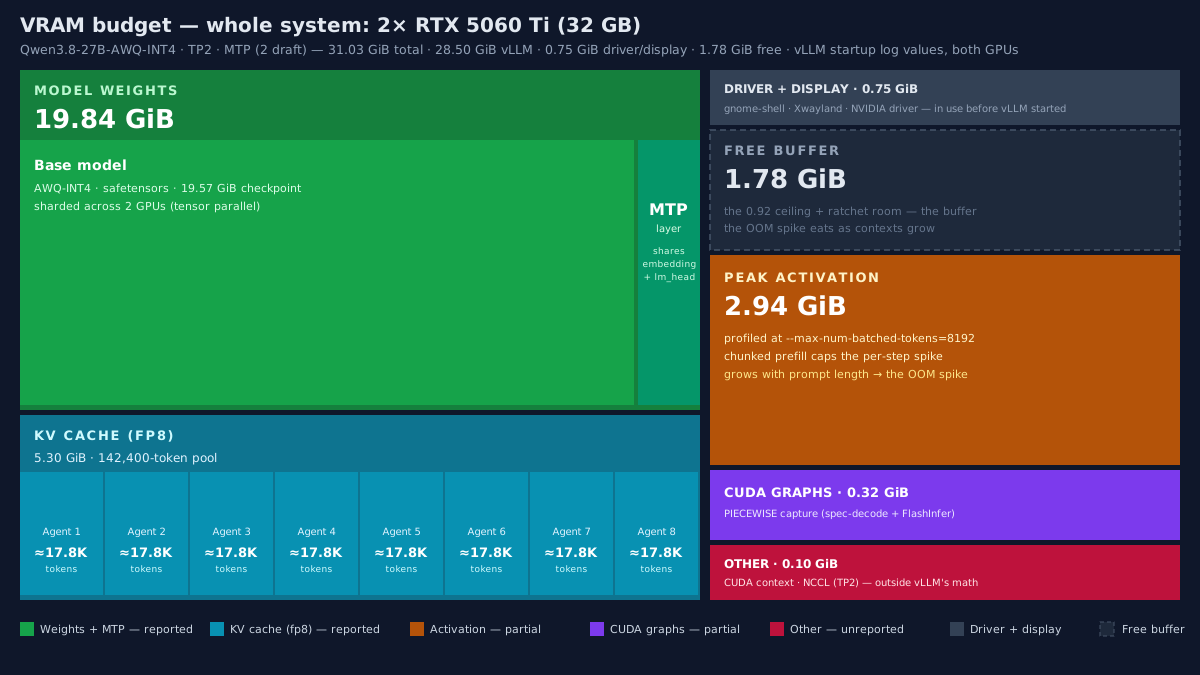
The critical insight: the set of memory usage vLLM reports covers 1, 2 and 3, but 4 and 5 live outside that calculation. When people do "weights + KV = X, so I should be fine", they are budgeting the two big, static items and ignoring the ~1–4GB of runtime overhead that the allocator and the driver quietly claim. That gap is exactly where OOM crashes come from.
Reading the Startup Log
At startup, vLLM profiles the GPU and logs the full breakdown. Here are the lines that matter from my real boot (everything else is noise):
INFO ... Detected MTP model. Sharing target model embedding weights with the draft model.
INFO ... Detected MTP model. Sharing target model lm_head weights with the draft model.
WARNING ... Enabling num_speculative_tokens > 1 will run multiple times of
       forward on same MTP layer, which may result in lower acceptance rate
WARNING ... CUDAGraphMode.FULL_AND_PIECEWISE is not supported with spec-decode
       for attention backend FlashInferBackend ...; setting cudagraph_mode=PIECEWISE
INFO ... Auto-fit max_model_len: reduced from 262144 to 142400 to fit in
       available GPU memory (2.65 GiB available for KV cache)
INFO ... GPU KV cache size: 142,400 tokens
INFO ... Maximum concurrency for 142,400 tokens per request: 1.00x
INFO ... Free memory on device (15.1/15.51 GiB) on startup. Desired GPU memory
       utilization is (0.92, 14.27 GiB). Actual usage is 9.92 GiB for weight,
       1.47 GiB for peak activation, 0.05 GiB for non-torch memory, and 0.16 GiB
       for CUDAGraph memory. Replace gpu_memory_utilization config with
       --kv-cache-memory=2716411495 (2.53 GiB) to fit into requested memory, or
       --kv-cache-memory=3602235392 (3.35 GiB) to fully utilize gpu memory.
       Current kv cache memory in use is 2.65 GiB.
Every number in this post comes from these lines. Three things stand out:
- The MTP module is included in the weight total: vLLM detected it, and the draft shares the target model's embedding and lm_head weights, so only the MTP layer itself is extra.
- The spec-decode warning ("multiple times of forward on same MTP layer, which may result in lower acceptance rate") foreshadows Trick #5. That's the reason my draft count ended up at 2, not 3.
- The log even tells you the exact
--kv-cache-memoryvalue to pin your allocation. More on that in Trick #1.
PyTorch Overhead (The Unreported Part)
Item 4 is the sneaky one. PyTorch talks to the GPU through a caching allocator: instead of calling cudaMalloc/cudaFree per tensor (which would serialize the whole GPU), it grabs large memory segments from the driver and carves blocks out of them for tensors. Freed blocks go to an internal free list: they are never returned to the driver. The man who wrote the allocator puts it bluntly: "If PyTorch ever uses N bytes of memory at one point, we will continue to keep that N bytes cached until a user specifically frees it" (Zach DeVito's guide to the CUDA caching allocator).
This means there are two numbers that never match:
- allocated: what live tensors actually hold
- reserved: what PyTorch has grabbed from the driver (what
nvidia-smishows)
Reserved ratchets up as workloads change: a bigger prefill chunk needs a bigger contiguous block → the allocator grabs a new segment → even after the prefill finishes and the blocks are freed, the segment stays reserved. On top of that:
- CUDA context: 300 MB to 1 GB per GPU, claimed before any of vLLM's own accounting.
- CUDA graphs: vLLM captures decode kernels into CUDA graphs at startup (this is a big part of its speed). Each captured graph holds its own memory pool. In my boot: 0.2 GiB per GPU of real, resident VRAM that is not weights or KV. Note the log above: with spec-decode + FlashInfer, vLLM had to fall back to
PIECEWISEgraph capture, and modern vLLM even profiles the graph memory and tells you the equivalentgpu_memory_utilization; the overhead is accounted, but it's still outside "weights + KV".
None of this shows up in "weights + KV". It shows up as nvidia-smi usage being meaningfully higher than vLLM's reported budget.
Other Overheads
Item 5 is the rest of the world that lives on the GPU:
- NCCL / P2P communication buffers (multi-GPU tensor parallelism only): communication buffers are allocated per rank. In my log this showed up as a modest 0.05 GiB of
non-torch memory. - cuBLAS, cuDNN and FlashAttention workspaces: kernel scratchpads that kernels claim per operation.
- Driver reservation: the NVIDIA driver itself reserves a slice of VRAM on top of everything.
- Encoder cache: for multi-modal models, the encoder cache is initialized and profiled at startup. If you run text-only, set the modality limits to zero so vLLM doesn't even profile that memory.
- Hybrid-model padding: Qwen3.8 is a hybrid mamba-attention model; the log warns "Add 3 padding layers, may waste at most 6.25% KV cache memory" and "Padding mamba page size by 0.88% to ensure that mamba page size and attention page size are exactly equal" (attention and mamba pages must line up). Small, real, and easy to miss.
The Math in Practice (My Real Numbers)
From my startup log, per GPU (dual RTX 5060 Ti 16GB, tensor parallelism, Qwen3.8-27B-AWQ-INT4 with MTP):
| Component | VRAM per GPU |
|---|---|
| Model weights (incl. MTP module) | 9.92 GiB |
| Peak activation (profiled) | 1.47 GiB |
| Non-torch memory (CUDA context, NCCL) | 0.05 GiB |
| CUDA graphs | 0.16 GiB |
| KV cache pool (fp8) | 2.65 GiB |
| Total | ~14.25 GiB of 15.5 GiB (target: 0.92 → 14.27 GiB) |
The KV pool is 142,400 tokens at fp8. "Maximum concurrency for 142,400 tokens per request: 1.00x" means one request could consume the whole pool. With --max-num-seqs=8, the pool is shared across up to 8 sequences, ~18K tokens each on average. That's the actual ceiling of my server, and it came from reading one log line, not from guessing.
The rule that keeps you safe: gpu_memory_utilization is not a target, it's a ceiling, and you must leave headroom under it. I run 0.92 only because expandable_segments and capped prefill make the ratchet predictable (below). On a machine where the allocator surprises you, 0.85–0.88 is the safer zone.
Why It "Works for a While, Then Crashes"
This is the failure mode that will confuse you if you haven't seen it: the server runs fine for a while, then, as context grows, PyTorch overhead takes a sudden spike and the server OOMs. It looks like a leak. It's not. Here's the mechanism.
The PyTorch Spike
At startup, vLLM profiles activation memory with representative dummy inputs. Your real workloads, however, are bigger in exactly one dimension: prompt length. Activation memory in the prefill phase scales with the number of tokens in flight (--max-num-batched-tokens). This isn't theory. A vLLM user measured it directly: with 80K batched tokens, 4.5 GiB was left for KV cache; with 16K, 11.3 GiB was. vLLM's answer: activation memory is reserved linearly with the prefill batch size, and it's carved out of your GPU budget at engine startup, statically. So:
- You boot with modest prompts → profiled activation peak looks small.
- An agent starts feeding 20K–50K token prompts → prefill activations are much larger than the profiled peak.
- The caching allocator has to satisfy those larger allocations → it grabs fresh, larger segments from the driver (reserved jumps).
- After the prefill, the blocks are freed within PyTorch, but the segments are never returned to the driver (reserved stays high).
- Every new context high-water mark ratchets the baseline further.
The result: a staircase pattern in nvidia-smi. Stable for a while, then a sudden step up, and if you pushed gpu_memory_utilization too close to 1.0, the next big prefill can't get its segment and you get torch.cuda.OutOfMemoryError and a crashed server. The spike happens exactly when the context grows, because that's when the allocator needs contiguous memory it never saw before. You can watch the same pattern in the wild: a writeup of the failure mode ("why your LLM OOMs with free GPU memory": 13 GB free in nvidia-smi, a 2 GB allocation still fails, and the smoking gun is "reserved by PyTorch but unallocated"), and a vLLM user with an AWQ model whose GPU usage crept from 50% to 99% over a day before the crash. It looks like a leak, but it's the staircase.
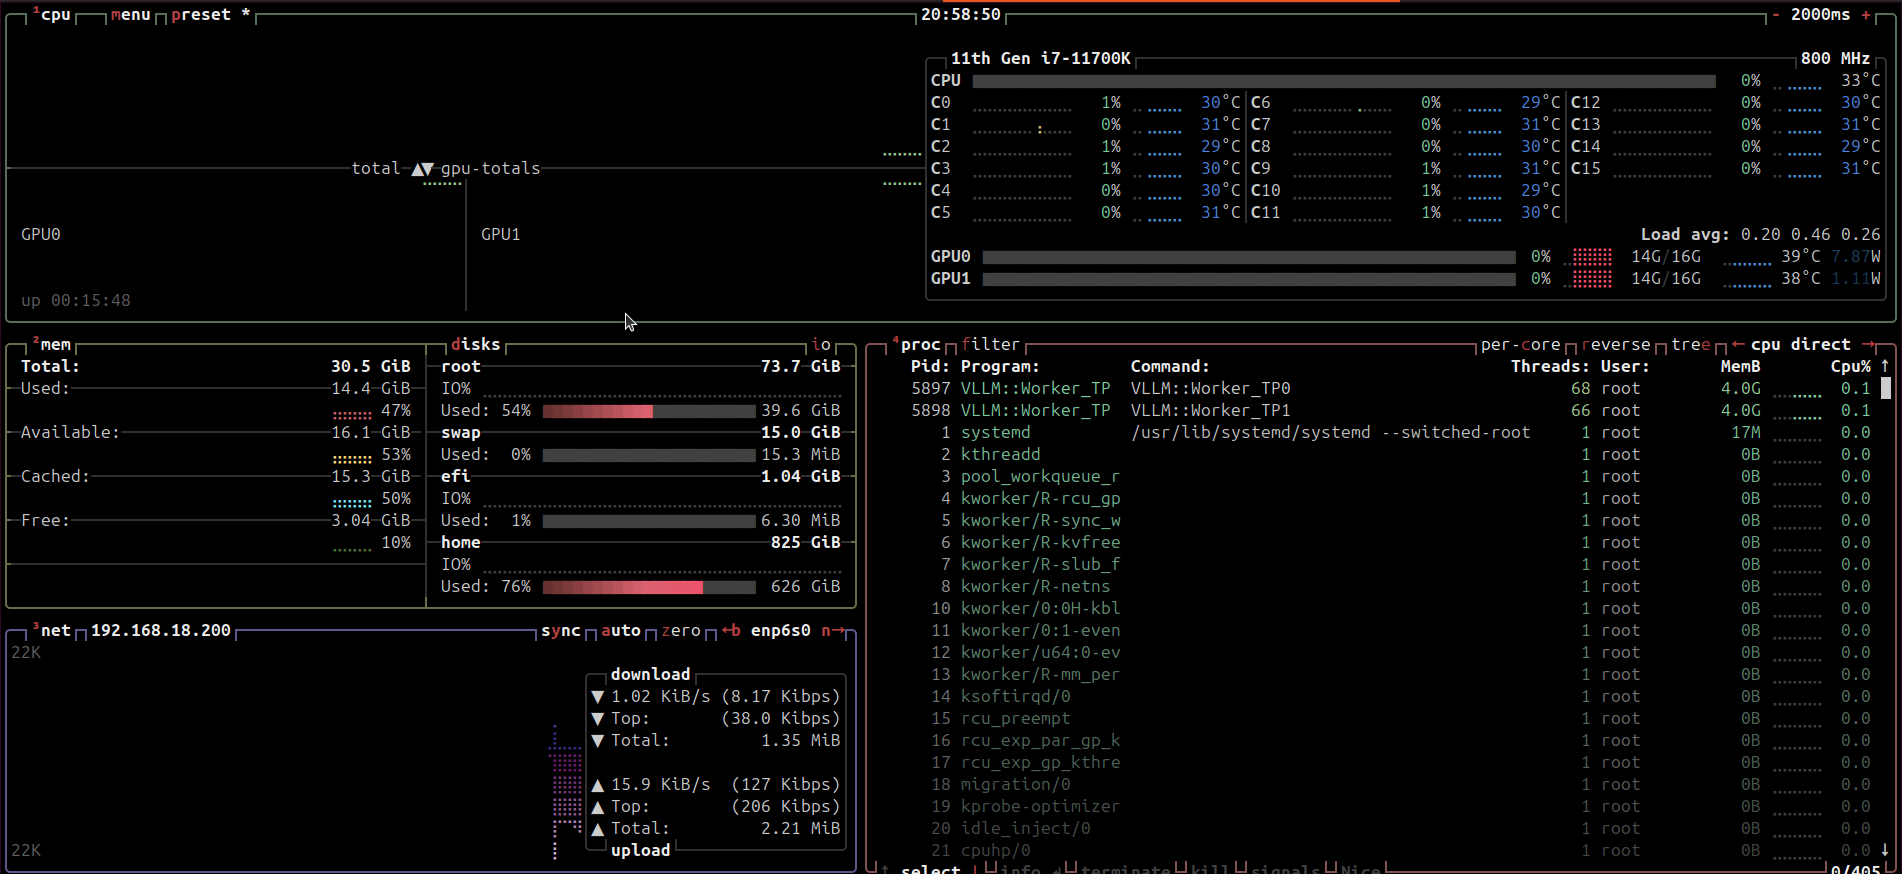
Once the model fits in the hardware and the overhead has enough room, usage is stable. This is what "stable" looks like in practice, my server at rest after boot: 14 GB resident per GPU, both cards flat, no swap touched:
Mitigations
- Leave headroom:
--gpu-memory-utilizationunder 1.0 with real room to spare. If you max out VRAM to squeeze more context KV, you are creating a huge reliability risk: the moment the allocator needs something unexpected, there is no room left. PYTORCH_CUDA_ALLOC_CONF=expandable_segments:True: makes the allocator use CUDA virtual memory management so segments can grow without needing physically contiguous space. This kills most external fragmentation and smooths the staircase into a gentle slope. It's the fix that the canonical "reserved ≫ allocated" OOM thread in the PyTorch tracker converges on.- Cap the context:
--max-model-lento what you genuinely need. Every 10K of unused context headroom is activation and KV memory you don't have to manage. - Cap prefill batch size:
--max-num-batched-tokens=8192is my sweet spot on consumer cards. With chunked prefill, vLLM processes prompts in chunks of at most that size, so a single step can never have more than 8192 prompt tokens in flight, no matter how long the incoming prompt is. That directly bounds the worst-case activation spike, and it's the difference between "long prompt arrives" and "long prompt OOMs the server". And 8192 is no random number: it's also the default chunk size vLLM V1 uses for online serving; I just benchmarked my way back to where the engine already is. --enforce-eageras a last resort: disables CUDA graph capture entirely, saving the graph pool memory. You give up decode speed; useful only when you are memory-starved.
Prompt Processing Speed: Prefix Caching
For speed during prompt processing, I enable prefix caching manually in the compose (--enable-prefix-caching). It is on by default in the V1 engine, but I pin it explicitly so a version upgrade can never quietly turn it off.
Here's what it does, and why it matters for agents. Every request pays two costs: prefill (processing the whole prompt, proportional to prompt length) and decode (generating tokens one by one). Prefix caching removes most of the prefill cost: vLLM keeps the KV of every prompt prefix it has computed, keyed by the tokens themselves. When a new request arrives, everything up to the longest previously seen prefix is a cache hit: only the new tokens get prefilled.
In an agent workload, almost every request is an extension of something you've already seen: the same system prompt and tool definitions repeated across your agents, and every conversation turn that appends to the previous one. So the "prompt" of the 50th message in a conversation is not 30K tokens of work: it's the ~300 new tokens at the end. Prompt processing goes from proportional to the whole conversation to proportional to the delta, and that is a big part of why the server keeps up with 8 agents at once.
One honest trade-off: cached prefixes occupy blocks in the same KV pool, so the cache competes with live context for space. On a fleet of agents sharing system prompts, it always wins that trade, and the reuse rate is enormous.
Tricks I Use
1. Don't Know Your Context Size? Let the Log Tell You
If you are not sure how long your context can be, don't guess: use auto. Boot with --max-model-len=auto (or any big value) at your maximum acceptable memory usage, and search the log for the recommended values. That's exactly what my boot log did:
INFO ... Auto-fit max_model_len: reduced from 262144 to 142400 to fit in
       available GPU memory (2.65 GiB available for KV cache)
INFO ... ... Replace gpu_memory_utilization config with
       --kv-cache-memory=2716411495 (2.53 GiB) to fit into requested memory, or
       --kv-cache-memory=3602235392 (3.35 GiB) to fully utilize gpu memory.
Two ground truths in two lines: the model wants 262,144 tokens of context, your hardware can actually serve 142,400, and vLLM even hands you the exact --kv-cache-memory value that pins the allocation. Once you know the number, pin it in your compose (I keep --kv-cache-memory right there, commented out); it also skips the profiling pass on boot, which makes restarts faster. From that ground, choosing your real --max-model-len is a decision, not a gamble: I want 142K in the pool. In the worst case 8 agents share it (~18K each), but in my real 3-agent load each one gets ~47K of context. If you need more, the answer is "buy VRAM, halve --max-num-seqs, or go fp8 KV", not a hope that it'll fit.
2. Avoid KV Offloading: It Bricks Your TPS
vLLM can offload KV cache to CPU RAM (and to remote storage in newer versions). Do not. It will brick your TPS. The entire reason vLLM is fast is that the KV pool lives in VRAM, paged and accessed at HBM bandwidth; the moment decode has to walk the PCIe bus for its own KV, token generation drops from "fast" to "archaeological". If your context doesn't fit in VRAM, that's a sizing problem. Fix it with fp8 KV, a smaller --max-model-len, or a smaller model. Offloading is the engine quietly agreeing to be slow.
3. Short on VRAM? llama.cpp Might Be Your Call
This is the honest counterweight to everything in this post: vLLM can demand more VRAM than llama.cpp for the same model. Two reasons:
- PyTorch overhead: the CUDA context, the allocator's ratcheted segments, the CUDA graph pools: a full 1–4 GB+ on top of the model, as we measured above.
- The lack of heavy quantization: GGUF's Q4_K_M packs ~4.85 bits/weight with almost no overhead, while the AWQ/INT4 safetensors that vLLM loads sit at 4 bits plus full allocator headroom. Same model, more VRAM.
That extra VRAM comes out of the KV pool, which reduces your max context size. And for coding, context is everything: an agent that only gets 10K of context instead of 40K is almost unusable: it can't hold the files it's editing. So: if you lack VRAM, better use llama.cpp: more quantization formats, less VRAM overhead, and it'll spill to RAM gracefully instead of failing fast. It's your call: vLLM for the server that serves many agents, llama.cpp for the machine where every megabyte of VRAM buys context.
4. FP8 KV Cache: Half the VRAM of Usual FP16
Another trick I found to save VRAM: --kv-cache-dtype=fp8. By default, vLLM stores the KV cache in fp16/bf16, the usual 2 bytes per element, which is generous precision for what is essentially a lookup table for attention. Storing it in 8-bit float halves the pool cost: the same 2.65 GiB pool holds roughly twice as many tokens, or the same 142K-token context fits in about half the VRAM.
The quality impact for agent work is negligible: the KV holds per-token attention states, not model weights, and fp8 precision is plenty for them. This was the lever that made 142K of context possible on 16 GB cards in the first place; with fp16 KV the pool would have been a fraction of that size. One requirement: the GPU needs native FP8 support (Hopper-class or Blackwell, my 5060 Ti qualifies; the log confirms it: kv_cache_dtype=torch.float8_e4m3fn, arch=sm120). On older Ampere cards, this trick is not available and the KV pool stays fp16.
5. Benchmark the MTP Draft Count: 2 Beats 3 on My Rig
The model ships with a single MTP layer, and vLLM auto-detects it, so the only knob is num_speculative_tokens: how many draft tokens per step. I first ran it with 3 (the "more is better" instinct) and benchmarked 2 vs 3 on this rig. 3 is slower. Two reasons:
- vLLM warns in the startup log: "Enabling num_speculative_tokens > 1 will run multiple times of forward on same MTP layer, which may result in lower acceptance rate." The model has one MTP layer, so every draft token beyond the first costs an extra sequential forward pass through that same layer. The cost of the draft chain grows with its length.
- A speculative chain is only as strong as its weakest link: drafts must be accepted in order, so the 3rd draft's marginal value is its own acceptance probability, and on this model and hardware it didn't pay for its extra forward pass.
The bench (decode, tokens/sec per request, full-run averages):
| Concurrency | MTP = 3 | MTP = 2 |
|---|---|---|
| 1 agent | 58.8 | 68.1 |
| 2 agents | 56.0 | 56.7 |
| 8 agents | 37.7 | 41.0 |
(The two runs used slightly different generation lengths, 128 vs 256 tokens, so read this as a directional comparison, not a controlled A/B. The direction is consistent at every concurrency level: 2 wins.)
There's a bonus, visible in the startup logs of the two runs: with 2 draft tokens the CUDA graph pool shrank from 0.20 GiB to 0.16 GiB per GPU, and that extra room came straight back as KV: my context ceiling went from 136,000 to 142,400 tokens. Less speculation, less graph memory, more context.
The takeaway: don't trust the default draft count and don't trust "more is better". Benchmark it on your model and your hardware.
Why vLLM Performs Better Than llama.cpp
My previous post framed this as a trade-off. Having run both on the same rig, I can now say it plainly: for a multi-agent server, vLLM is the better machine. Five reasons.
1. Less Energy Consumption
A GPU draws near-peak power whenever it's executing kernels: the SMs don't care whether the work is useful. So joules per token is really useful work per kernel. Continuous batching is the difference: vLLM packs every in-flight request into the same kernels, so each pass of the GPU does 8x the useful work for roughly the same power. llama.cpp's single-stream decode runs the same kernels with a batch of one: the GPU is active, burning watts, producing one sequence. Multiply that across the same workload and the energy bill is structurally higher.
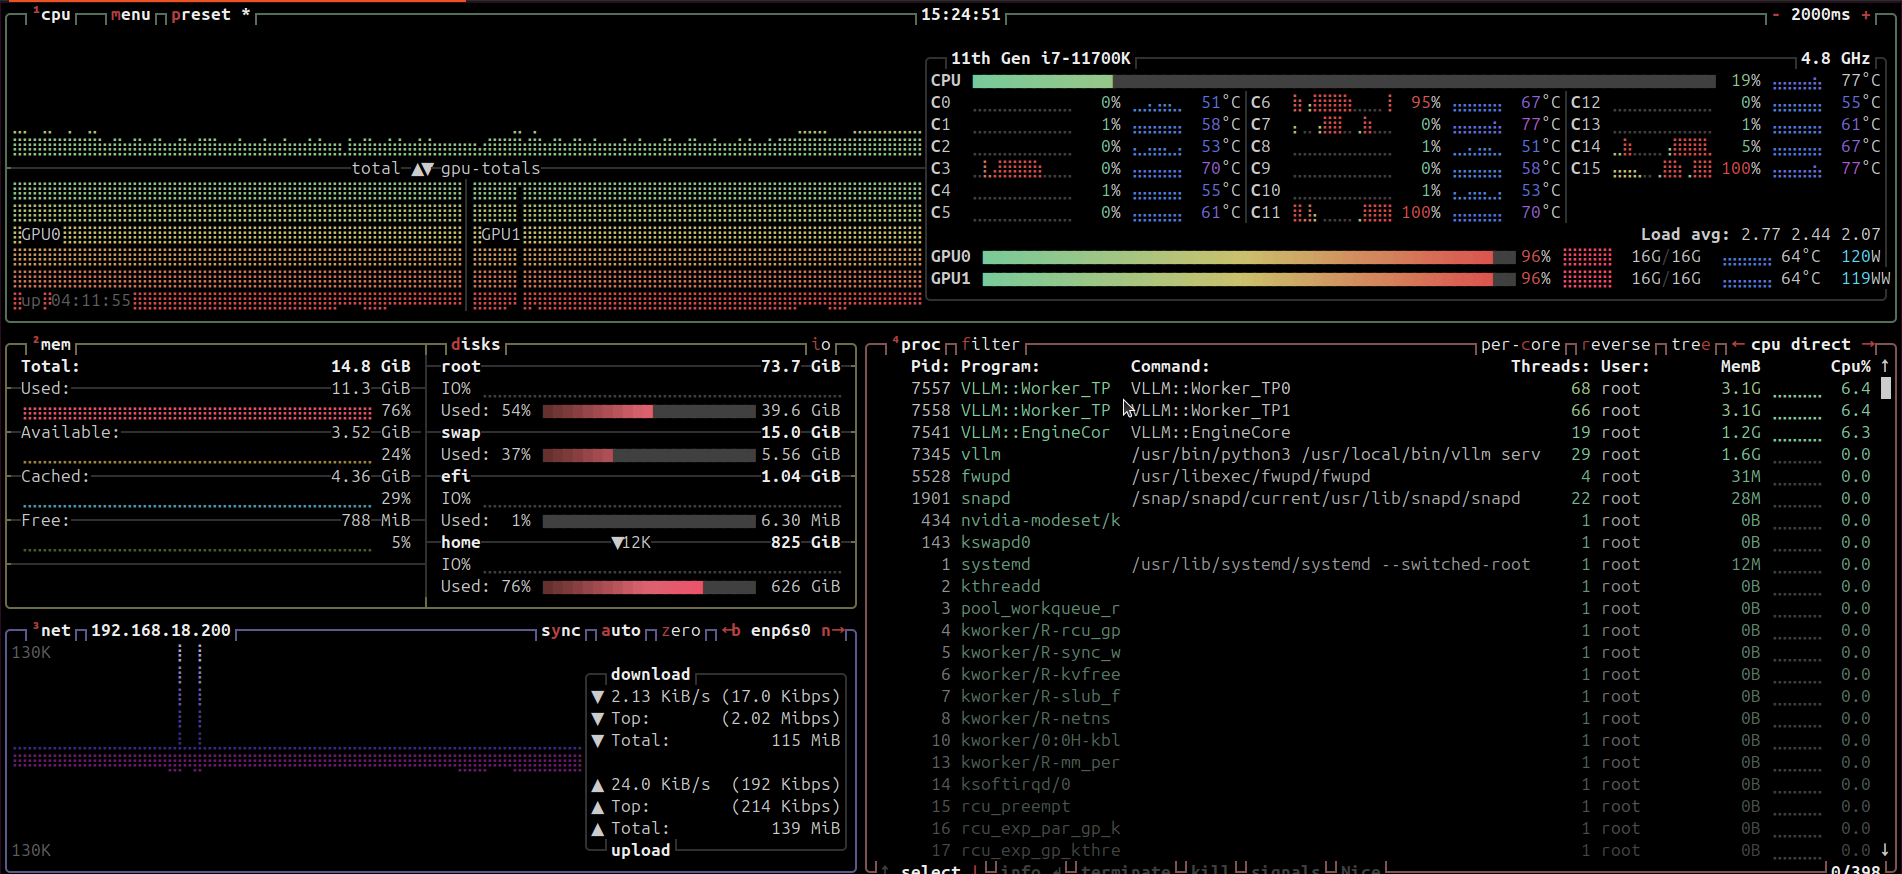
The numbers from the load screenshot above: both GPUs at 96% utilization, ~128 W + ~119 W ≈ 247 W: and in that window the server is not idle-burning, it's processing a full batch of concurrent requests.
I measured the comparison directly. Running the llama.cpp server at its maximum token-production rate (sustained generation, both cards pegged), each GPU pulls ~180 W, right at the 5060 Ti's power ceiling. Running the same workload on vLLM, each GPU settles at ~120 W: roughly a third less power for the same tokens, and exactly the per-card numbers in the screenshot above.
The savings are the kind you feel in a room: less heat radiating off the rig, a lower electricity bill, and fans that don't have to spin at full speed fighting for fresh air. A GPU at 120 W instead of 180 W doesn't have to cool itself as hard, which is also why the machine stays quieter running around the clock.
There's a second, subtler saving: prefix caching. When eight agents share a system prompt, vLLM pays for that prefix's prefill once. A single-stream engine reprocesses it on every request. Wasted computation is wasted energy.
2. No RAM Leaks, No Growth
vLLM pre-allocates everything at startup: the KV pool, the CUDA graphs, the buffers. After boot, its memory profile is flat: the at-rest screenshot is the same footprint hours after boot, with days of serving behind it. llama.cpp, in my experience, shows the classic "starts clean, grows with usage" pattern: the CUDA compute graph is re-captured as batch sizes grow, per-slot state and host buffers accumulate, and the caching allocator keeps its ratcheted segments. Over days of continuous serving, the gap between day one and day three is real and measurable.
3. Stable RAM/VRAM Over Time and Under Concurrency
This is the one that matters for a 24/7 server. vLLM's memory is a fixed budget decided at boot: the scheduler knows exactly how many KV blocks exist, and when it runs short it preempts (recomputes later) a request instead of growing. Concurrency changes how the budget is shared, never how much there is. So the numbers are the same on day one, day thirty, at 1:00 AM, and with 8 agents or 1.
llama.cpp does the opposite: its footprint is decided by the biggest thing you've asked it to do so far: longest context, largest batch, highest parallel slot count. Memory grows with usage, which means a 24/7 server that serves occasional huge documents will quietly consume more and more until something gives.
4. The Hardware Overhead of llama.cpp
llama.cpp is a beautifully engineered single-stream engine, but it pays hardware tax that vLLM doesn't:
- Host/device round trips: tokenization, batch construction and sampling happen on the CPU, and each step involves synchronization with the GPU. Per-token, that's a lot of small PCIe round trips.
- Compute graph overhead: graphs are captured across a range of batch sizes as workloads evolve; capture is a real cost in time and memory.
- Attention in full: without paged attention, the attention working set is materialized per pass rather than paged through HBM like vLLM's PagedAttention keeps it.
vLLM's design pushes everything to the GPU: CUDA graphs replay with minimal host involvement, kernels are batched, and PagedAttention keeps the KV working set in HBM. The GPU spends its cycles computing instead of waiting for the CPU and the PCIe bus.
5. Concurrency and Long Prompts: Where llama.cpp Degrades
Two practical problems I ran into with llama.cpp that vLLM simply doesn't have:
- Concurrent requests divide each other's rate: llama.cpp processes prompts one at a time, in line, so every new concurrent request cuts the per-request numbers: token generation (TG) and prompt processing (PP) both drop as concurrency grows, and each agent ends up waiting for the ones ahead of it. vLLM's continuous batching works the other way: new requests join the running batch instead of queueing behind it, so 8 agents share GPU time without blocking one another (Batching).
- Long prompts slow the engine down: on llama.cpp, the server gets measurably slower as the input prompt grows, and that slowdown carries into token generation. vLLM is far more resilient: even with the input prompt maxed out at ~140K tokens, right against the 142,400-token context ceiling, the token generation rate (TG) holds. Chunked prefill and prefix caching (see Prompt Processing Speed) make a huge prompt a bounded, parallelizable cost instead of a clog on the decode loop.
A Fair Caveat
llama.cpp still wins where it should win: a single interactive user, GGUF quantizations (which vLLM can't load), and "one binary, zero dependencies". For my use case (a server serving parallel agents around the clock), vLLM is the better tool. Different tools, different jobs. (And see Trick #3 for when llama.cpp wins on pure VRAM efficiency.)
Batching: 8 Agents in Parallel Without Losing TPS
This is where vLLM's design pays off. Continuous batching means every new request that arrives is inserted into the running batch: no queue, no per-request GPU session.
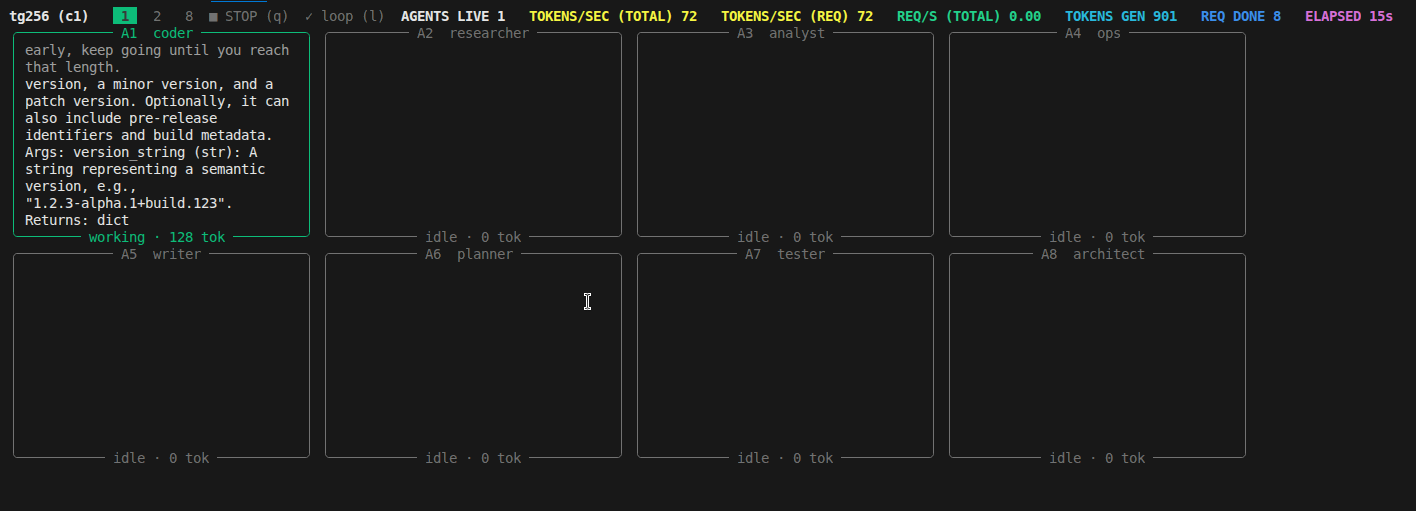
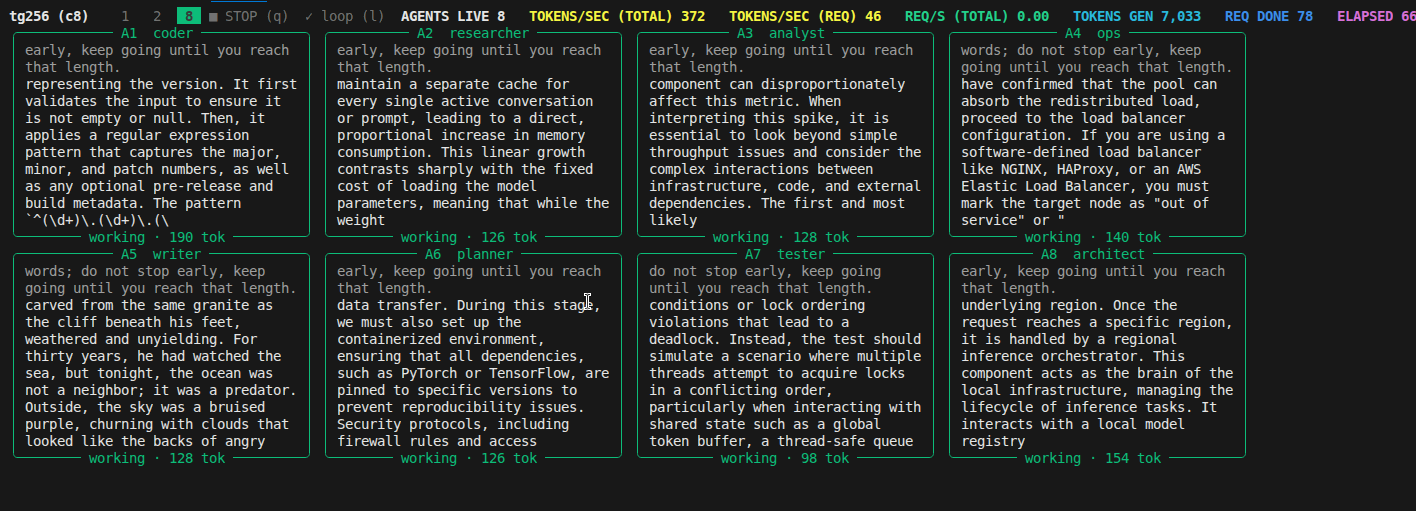
First, what my real usage looks like: I don't run a fleet of 8 agents around the clock. My regular work is coding tasks and agentic systems on the DeepSeek Harness, at most 3 agents at a time, and that rides comfortably inside the numbers below. The 8-agent run is a benchmark: I wanted to know how far this hardware can go, so I pushed it to the edge with my own harness (chinchilla-llm-bench):
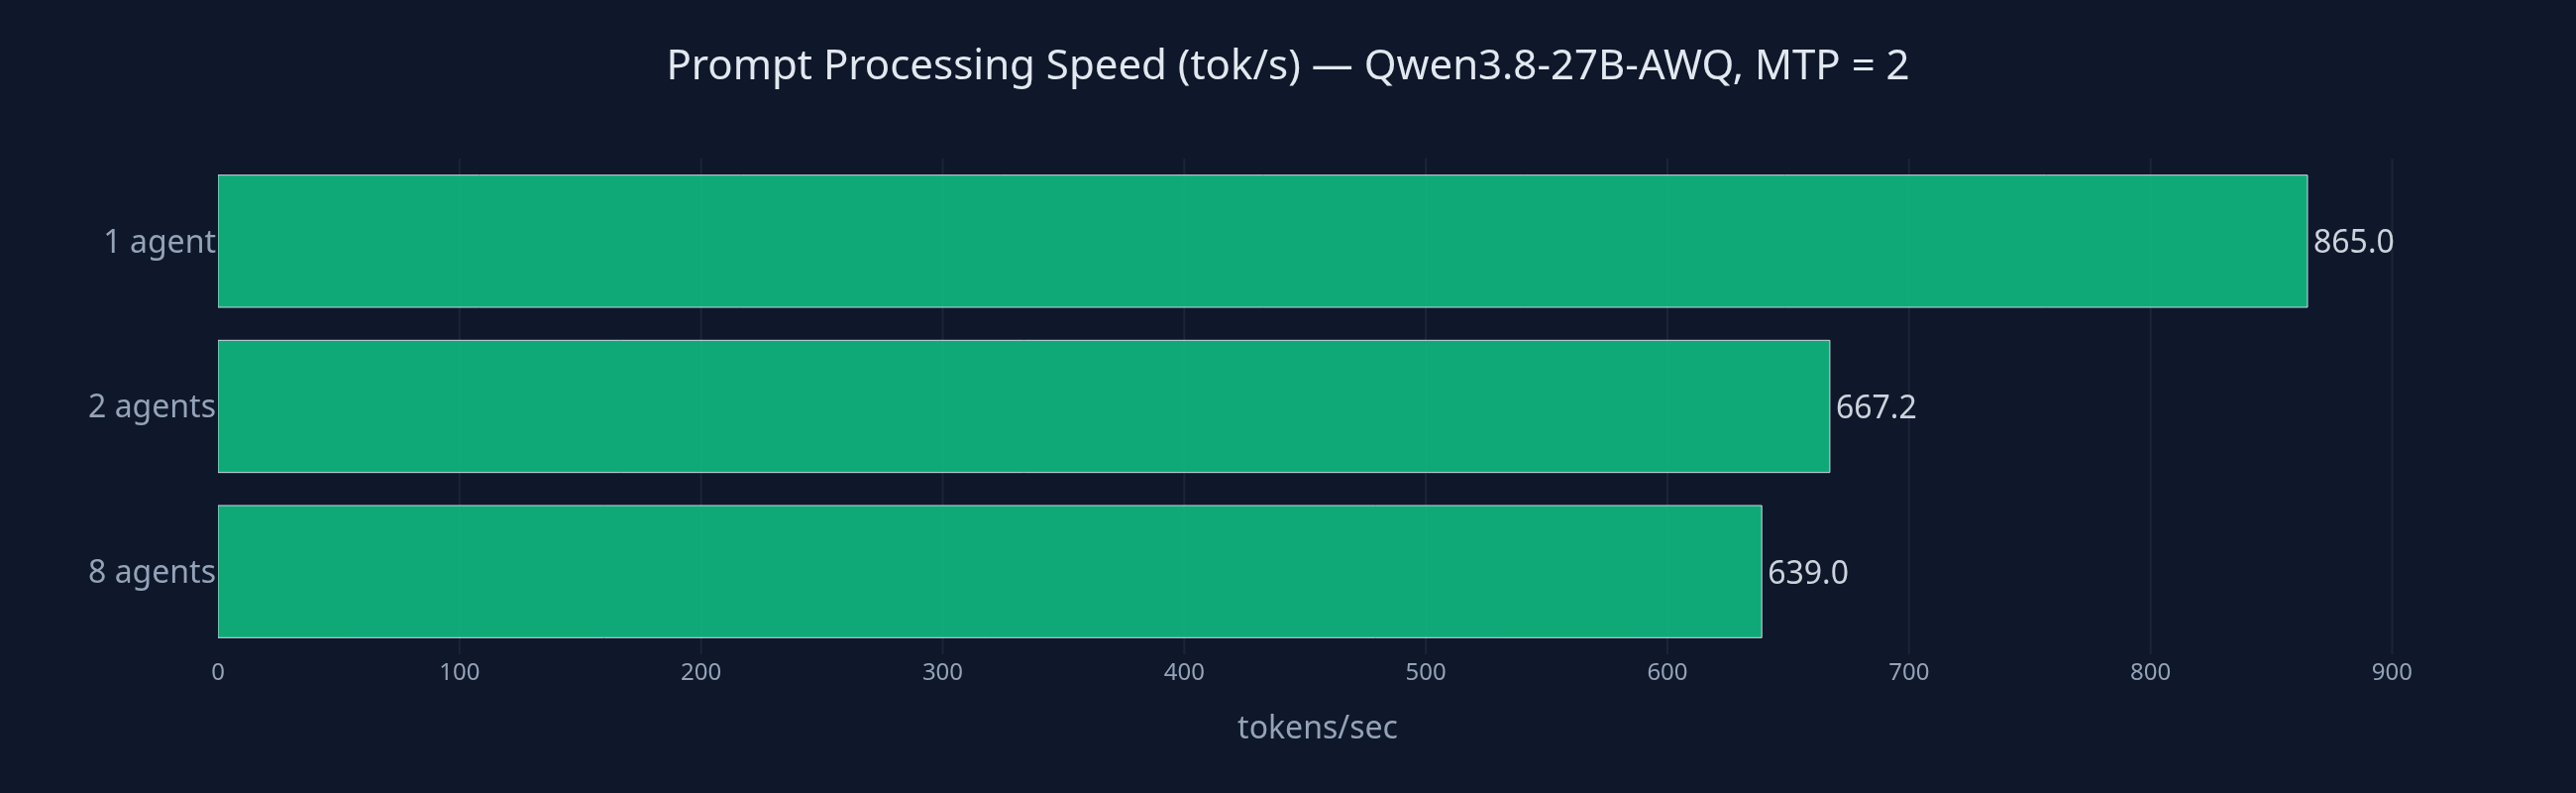
uv run chinchilla-bench --base-url http://mylocalserver:1235/v1 --model qwen3.8-27b-awq --pp 200 --tg 256 --c 1 2 8That's 200 tokens of prompt, 256 of generation, at concurrency 1, 2 and 8. A bigger swarm of agents for experimental work is on my roadmap. For now, 3 concurrent is my ceiling and it's comfortable. Full-run averages, MTP = 2:
| Agents live | Prefill t/s (total) | Decode t/s (per agent) | Decode t/s (total) |
|---|---|---|---|
| 1 | 865.0 | 68.1 | 68.1 |
| 2 | 667.2 | 56.7 | 80.0 |
| 8 | 639.1 | 40.9 | 225.9 |
Read that trade the right way: per-agent decode TPS goes from ~68 to ~41 tokens/sec (still about 40x typing speed for an agent), while the machine's total throughput triples from ~68 to ~226 tokens/sec. Batched is exactly what this is for: no agent loses 3x, the rig gains 3x. Time-to-first-token with a single agent: ~234 ms.
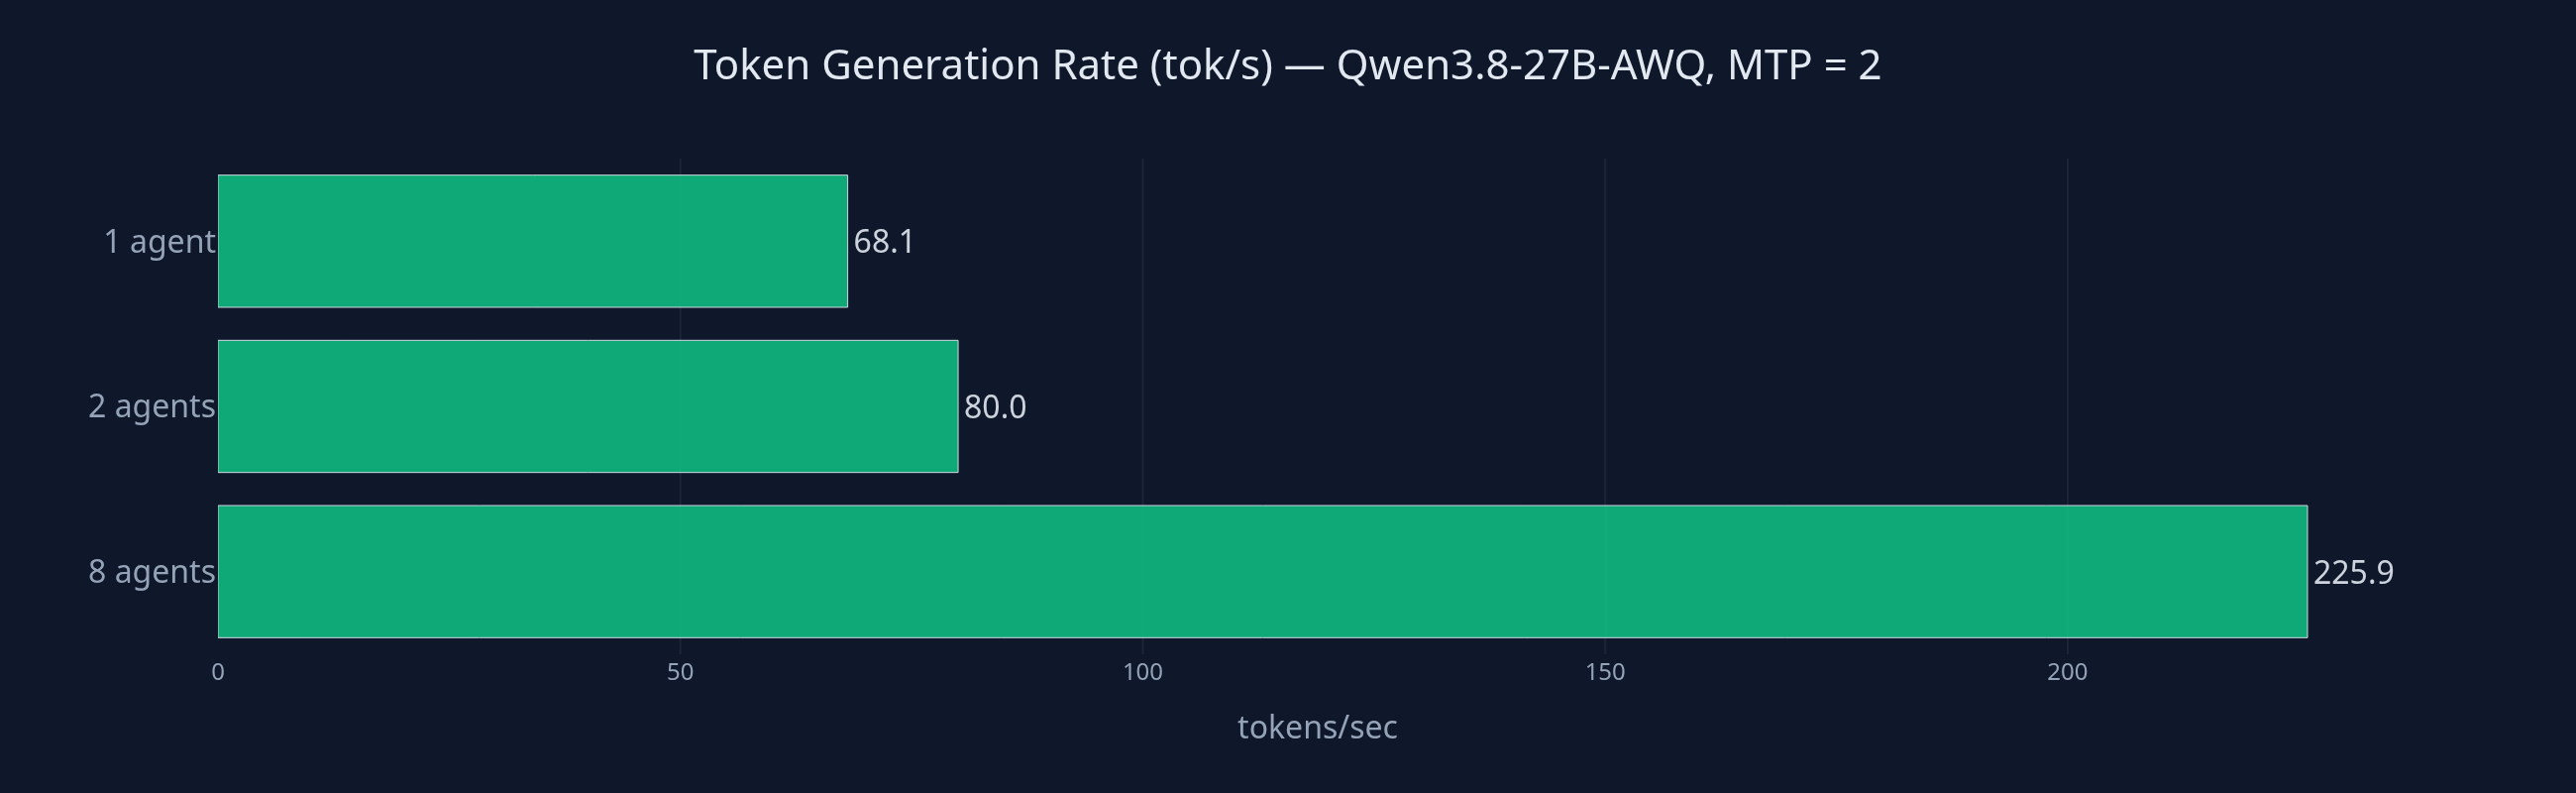
The cap is deliberate. --max-num-seqs=8 is not a magic number: I benchmarked many concurrency settings on this rig, and 8 is the maximum efficiency it achieves. Above 8, the marginal agents start stealing GPU time and the per-agent TPS drops noticeably, so 8 concurrent sequences is where I stop.
The one thing to watch: context growth. Every agent's growing conversation eats KV blocks. As the KV pool fills, vLLM starts preemptions (look for Sequence group ... was preempted in the logs) and throughput drops. The fixes are the usual levers: larger KV pool (headroom!), --kv-cache-dtype fp8 (halves the pool cost), or fewer concurrent agents.
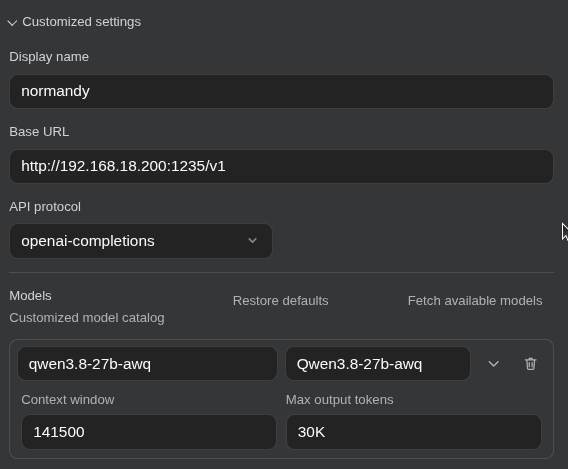
The client side is as simple as the server: the DeepSeek Harness GUI points straight at the OpenAI-compatible endpoint:
System RAM and Swap
As covered in the setup section: the vLLM server alone will consume around 16GB of RAM, but you do not necessarily need 24 or 32GB of system RAM: the kernel spills the rest to swap automatically. Here's both configurations on the same server:
16 GB of RAM: under full agent load, the system runs at 11.3 GiB in RAM and ~5.5 GiB in swap. That's the "around 16 GB" figure, and the impact on the host is negligible. This is the screenshot at the top of the post.
32 GB of RAM: the same server fits everything in RAM (14.4 GiB used, 16 GiB available) and swap is essentially untouched. Same behavior otherwise, just no swap traffic.
No tuning needed, no vm.swappiness hacks, nothing. Docker + the Linux kernel + swap = a RAM budget you don't have to think about.
Conclusion
- Running vLLM is more efficient than running llama.cpp: cheaper in energy, stable in memory, total throughput that triples when you batch 8 agents, and the ability to do parallel things that llama.cpp can't do at all.
- Batching is why: continuous batching + PagedAttention let you safely run 8 agents in parallel without losing much performance. Keep an eye on context growth: that's what will dim your TPS first.
- The VRAM math has 5 terms, vLLM only reports 3: budget the PyTorch overhead and the other runtime overheads with real headroom,
expandable_segments:True, and capped prefill, or the staircase will OOM you the day a long prompt arrives. - Read the log, don't guess:
--max-model-len=autoplus the startup log gives you the exact context ceiling and the exact--kv-cache-memorypin for your hardware. - 16 GB of RAM is enough: no 24/32 GB requirement; the kernel and swap absorb the overflow with a negligible impact.
- Easy to set up: a single Docker compose runs on any machine, no overhead installation, no CUDA toolkit, no Python environments.
- Enterprise-grade software to run your LLM models is priceless, and it's from the open-source community. This is the same engine that powers some of the biggest LLM deployments on earth, running on a 5-year-old consumer desktop with 16 GB of RAM.
If you're running llama.cpp for a single user, keep it: it's great. But the moment you want parallel agents, a stable 24/7 server, and a memory profile you can predict from the startup log, move to vLLM. Set the headroom, read the log, watch the KV pool, and it just works.
Follow me for more posts on local AI infrastructure, self-hosted agents, and practical machine learning on consumer hardware.
References
- chinchilla-llm-bench: my benchmark harness. The concurrency numbers in the Batching section come from
uv run chinchilla-bench --base-url http://mylocalserver:1235/v1 --model qwen3.8-27b-awq --pp 200 --tg 256 --c 1 2 8 - vLLM repository: the serving engine
- vLLM: Conserving Memory: the official memory guide
- vLLM: Optimization and Tuning: V1 optimization levels, preemption, chunked prefill,
--kv-cache-memory - vLLM: MTP (Multi-Token Prediction): native MTP speculative decoding
- vLLM: Using Docker: the official Docker deployment guide (including shared memory for multi-GPU)
- PyTorch Memory Visualizer: diagnose allocator spikes with memory snapshots
- A guide to PyTorch's CUDA Caching Allocator: Zach DeVito (who built it) explains the ratcheting segments
- Why Your LLM OOMs With Free GPU Memory: reserved-but-unallocated blocks and fragmentation, the "works for a while, then crashes" mechanism
- vLLM forum: max_num_batched_tokens vs KV cache memory: measured proof that prefill batch size reserves activation memory at startup
- PyTorch issue #160308: reserved ≫ allocated → OOM, and the
expandable_segmentsfix - NVIDIA: Memory Issues — CUDA Graph Best Practice: why reserved memory is expected to be much higher than allocated after graph capture
- r/LocalLLaMA: memory "leak" with vLLM + AWQ: 50% → 99% over a day, then crash
- llama.cpp repository: the engine from my previous post
- My previous post: Running Local LLMs on Consumer Hardware: the llama.cpp baseline this post compares against
Disclaimer: this post was written with the help of Qwen3.8-27B-AWQ, running locally on Normandy.